
About this guide
This guide is designed to help you understand our new Retailer Dashboard.
Contents
| Table of Contents |
|---|
General information
What's the Retailer Dashboard?
A new product from Fruugo that helps you understand your Fruugo performance for the previous month, across a number of dimensions.
We hope this will help you identify opportunities for growth within the Fruugo platform.
For now, it’ll be sent as a static PDF via email each month, but our future ambition is to provide a more interactive version in our enhanced Retailer Portal.
How do I access it?
The Retailer Dashboard is being rolled out in stages, and is currently only available to a subset of our retailer network.
You’ll receive an email monthly with your dashboard attached as a PDF if it has been made available to you.
If you don’t yet receive the dashboard monthly email, we hope to be able to roll it out to you very soon.
Further help
If this guidance doesn’t answer your question:
If you have a Fruugo Account Manager, you can drop them an email or phone call regarding the dashboard.
If you don’t have direct contact to a Fruugo Account Manager, you can email account.management@fruugo.com for assistance.
Guide to the dashboard
Here we provide a more detailed breakdown of each section of the dashboard to help you understand what each dimension shows.
For a dial such as this:
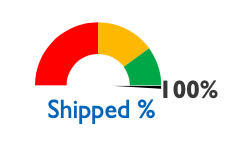
Green = strong performance
Amber = moderate performance, there are improvement opportunities
Red = low performance, strongly recommend corrective action
Peer group comparison
Some dials are also a direct comparison between your performance and the other retailers in your peer group. Indicated by dials such as this:
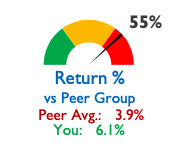
Your peer group are the other retailers who sell in a similar top level category as you - such as Clothing and Accessories.
In this case:
the green text shows your value (such as 6.1% of orders are returned in the example above).
the red text shows your peer groups average value (such as 3.9% of other retailers orders are returned in that category in the example above).
the dial shows a comparison between these two numbers as a % (so the retailer is 55% worse than their peer group in the example above).
In this instance, as the dial is red, we’d strongly recommend corrective action to improve performance in line with top performing retailers in that category.
All data pertains to the previous month from the date of dashboard issue and is indicated here:

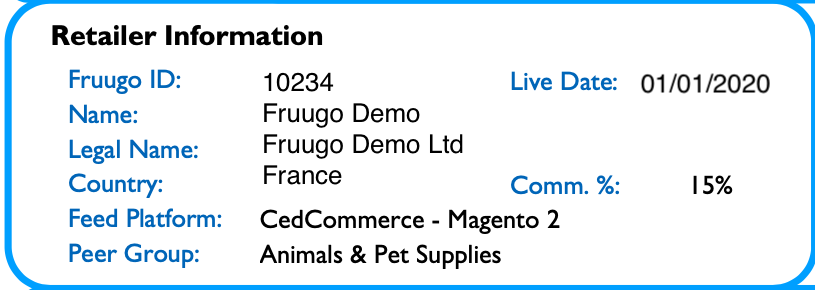
Retailer information
Section breakdown
General information relating to your business.
Element | Shows |
|---|---|
Fruugo ID | Your unique Fruugo identifier number |
Name | Your business name as registered with Fruugo |
Legal Name | Your legal business trading name as registered with Fruugo |
Country | The country in which you’re based |
Feed Platform | The method through which you integrate with Fruugo |
Peer Group | This is the primary category in which you sell products, and is used for comparison purposes throughout the dashboard to help you understand your performance compared to retailers selling similar products on Fruugo |
Live date | The date you started with Fruugo |
Comm. % | The general commission you pay as a % on orders (doesn’t include any country variance at this time) |
Top tips
Regular feed and stock updates - ensuring products are up to date, with high quality listings and accurate near real-time stock levels ensures customers are more likely to buy, and less likely to raise an issue post-order. We provide a variety of high quality integration methods to achieve this including use of our Stock and Order APIs.
Commission increase options - we reinvest much of the commission you pay into advertising your products. You have the option to increase your commission for use in additional advertising spend through the Retailer Portal, or by contacting your Fruugo Account Manager if assigned.
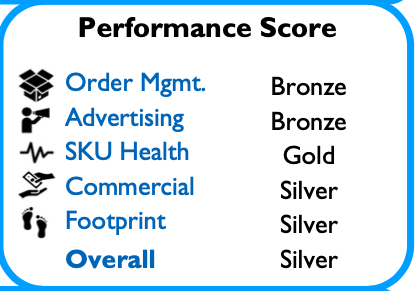
Performance Score
Section breakdown
Provides a score for each of the main dashboard sections and an overall score compared to retailers selling in the same product categories. These scores can be used as an indication of where improvements are needed or there are opportunities for growth.
Gold = Strong performance compared to peer group, you are generally performing better than the majority of your peers in this area.
Silver = Reasonable performance compared to peer group, you are performing at a similar level to the majority of your peers in this area. There are however some opportunities for improvement and growth to differentiate yourself and achieve better results.
Bronze = Lower performance compared to peer group, you are typically performing at a lower level than the majority of your peers in this area, there are many opportunities for improvement and growth to achieve better results.
If you are Silver or Bronze in any area, take a look at the corresponding section for more detailed data to help you identify improvement opportunities.
Top tips
Review the detailed sub-sections below - we recommend using these performance scores to guide where you complete further analysis.
Order Management
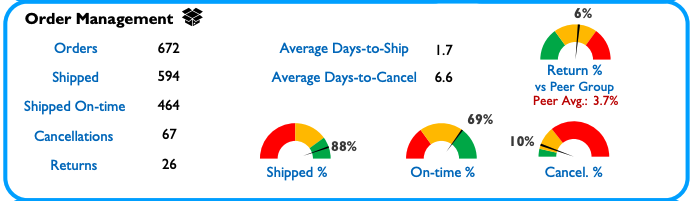
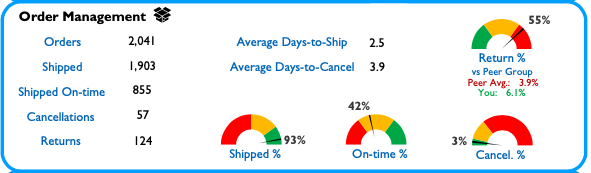
Section breakdown
Focuses on the prime dimension of orders and the critical activities in the order management process.
Element | Shows |
|---|---|
Orders | Total orders achieved in the month |
Shipped | Total orders shipped in the month Can be greater than order number because shipments can display in this month that are from the previous month. |
Shipped On-Time | Total orders shipped within lead time if provided by you or 24 hours from order confirmation if no lead time (including weekends) |
Cancellations | Total number of orders subsequently cancelled after purchase in month |
Returns | Total number of orders subsequently returned in month (everything that gets refunded is classed at a return as we don’t currently differentiate between types of return) with a direct to peer group comparison |
Average days-to-ship | Typical time taken to mark order status as shipped on average (in days) across all your orders. Aim is to be as close to <1 day as possible for highest customer satisfaction. |
Average days-to-cancel | Time elapsed between order placed and cancellation being requested |
Shipped % dial | % of your orders shipped. Aim is to be 100% |
On-time % dial | % of your orders shipped in ‘on-time’ within lead time if provided by you or 24 hours from order confirmation if no lead time |
Cancel % dial | % of your orders cancelled. Aim is to be as close to 0% as possible. |
Return % vs. Peer Group dial | Your return % relative to peer group, the red text is a benchmark to show you the average in the peer group. e.g. in this sample 265% means this retailer is 265% higher than the average returns rate for their peer group. |
Top tips
High quality product listings - critical to converting customers to buy once we’ve acquired them from advertising is the product listing itself. High quality images, detailed and accurate descriptions and specifications are proven to lead to greater sales for in demand products. Even small things such as having the right data in the right field is critical for attributes such as size and colour. This all helps to reduce the likelihood of a return, cancellation or enquiry from a customer.
Rapid confirmation and dispatch - confirming and dispatching orders within 24 hours of them being placed is key to customer satisfaction and reducing enquiry volumes for ‘Where’s my order?'. This is particularly important for international orders, where delivery times will be longer than domestic purchases.
Rapid and effective response to enquiries - if a customer runs into an issue with their order, fast and effective response to their enquiry with great customer service keeps satisfaction high despite the issue. We ask you to respond within 48 hours, but quicker is best.
Tracking of shipments - wherever viable, we recommend utilising tracked delivery services to help keep customers at ease while awaiting delivery. We find this also decreases the likelihood of one of the most common enquiries ‘Where’s my order?'.
Advertising Performance
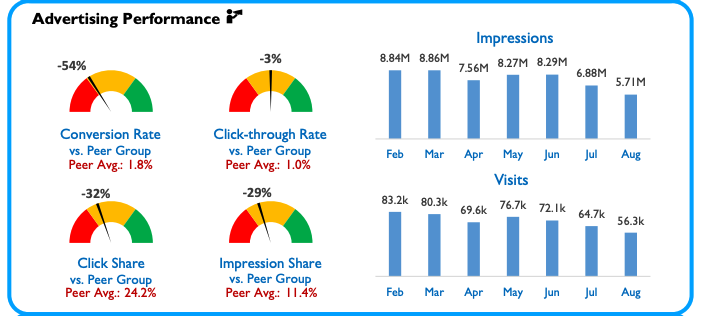
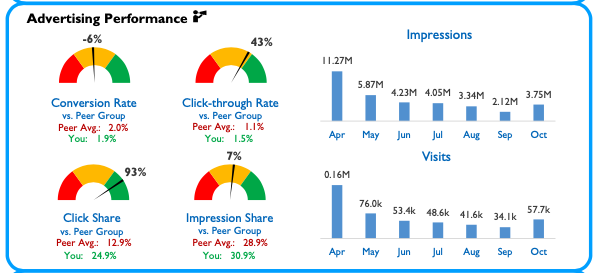
Section breakdown
Focuses on how your products have performed through advertising across platforms such as Google Ads and Shopping.
Red text is a benchmark to show you the average in the peer group.
Each dial also includes a direct peer group comparison.
Element | Shows |
|---|---|
Conversion Rate vs. Peer Group | Rate at which your clicks lead to conversions relative to peer group e.g. if you’ve had 100 clicks and you’ve had 1 conversion your own conversion rate = 1% and in this sample, the retailer is -1% below the average for the peer group. |
Click-through Rate vs. Peer Group | Rate at which impressions lead to clicks relative to peer group e.g. if you’ve had 100 impressions and 25 clicks click-through rate = 25% and in this sample, the retailer is 24% higher than the average for the peer group. |
Click Share vs. Peer Group | Share of the clicks you’re gaining when in competition with other sellers of your products e.g. if click share = 30% then your ads have been clicked on 30% of the time where eligible to display and in this sample click share is 77% higher than the average for the peer group |
Impression Share vs. Peer Group | Share of the impressions (views) you’re gaining when in competition with other sellers of your products e.g. if impression share = 30% then your ads have shown up 30% of the time where eligible to display and in this sample impression share is 28% higher than the peer group |
Impressions chart | How many potential customers saw your adverts for your products |
Visits chart | Volume of clicks on your adverts for your products |
Top tips
High quality product listings - critical to converting customers to buy once we’ve acquired them from advertising is the product listing itself. High quality images, detailed and accurate descriptions and specifications are proven to lead to greater sales for in demand products. Even small things such as having the right data in the right field is critical for attributes such as size and colour. This all helps to reduce the likelihood of a return, cancellation or enquiry from a customer.
Google SKU Health
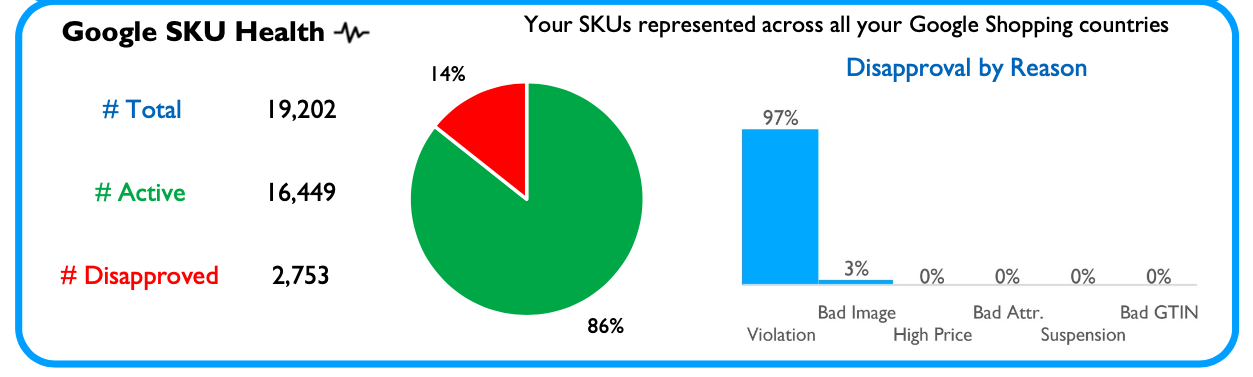
Section breakdown
This section is an indicator section only, providing a prompt to investigate any SKUs with an issue.
Information relating to your products relationship to Google, as the primary marketing and advertising engine for your products. SKUs are replicated as ‘virtual’ SKUs across all countries in which you sell and so will appear higher than the number of ‘real' SKUs you stock on Fruugo.
Element | Shows |
|---|---|
# Total | How many virtual SKUs are listed on Google for marketing and advertising |
# Active | How many of your total listed virtual SKUs are active with Google (includes SKUs with issues that Fruugo takes care of) |
# Disapproved | How many of your total listed virtual SKUs are not active with Google due to reasons in your control - see disapproval by reason chart |
Pie chart | Active SKUs (green) vs. Disapproved SKUs (red) |
Disapproval by Reason chart | Provides breakdown of reasons for disapproval where in your control, with % of your disapproved SKUs assigned to reasons affecting them |
Top tips
Decrease disapproved SKUs - this can be done by utilising the disapproval reason chart and updating your product feed to address these issues. In the case of policy violations, we recommend reviewing and understanding the Google policies in depth and ensuring your products meet these requirements.
Commercial Performance
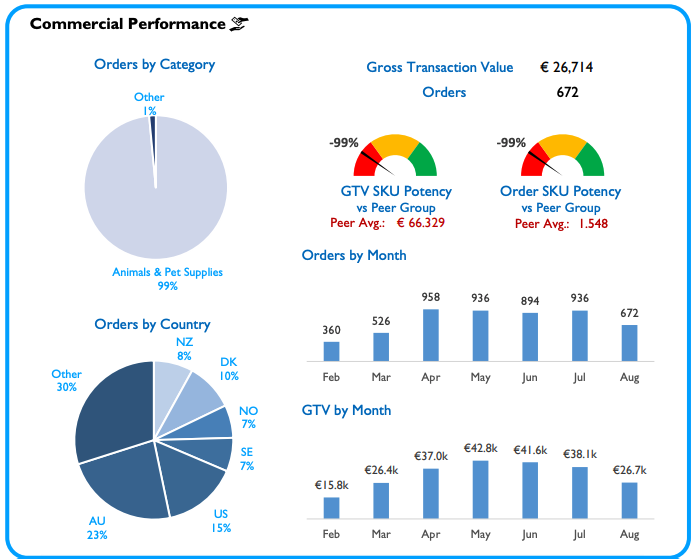
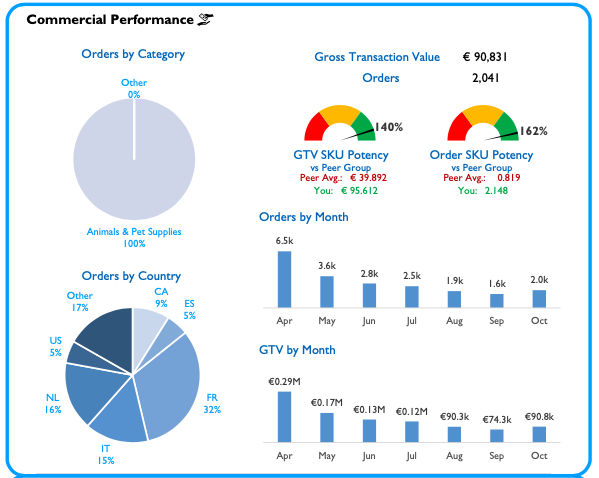
Section breakdown
Primarily financial and order volume data provided across a range of dimensions to help you consider overall commercial performance.
Red text is a benchmark to show you the average in the peer group.
Each dial also includes a direct peer group comparison.
Element | Shows |
|---|---|
Orders by Category chart | Which major categories your orders fall into as a % |
Orders by Country chart | Where in the world your orders are coming from as a % ‘Other’ groups together all countries in which you achieve <5% of your sales to help you see your top performing countries. A future version of our performance reports will provide the ability to drill down into the ‘Other’ category in more detail. |
Gross Transaction Value | The total value of your orders for the last calendar month |
Orders | Total orders in volume for the last calendar month |
GTV SKU Potency vs. Peer Group dial | Potency is how effective your SKUs are at selling and therefore generating you Gross Transaction Value compared to your peers as a whole e.g. in this sample this retailer is 106% more potent for generating GTV than their peers A higher SKU potency typically provides more GTV, so aim is to be in the green section. High potency is achieved by having products that people want (high demand) at competitive prices and good quality product listings (high data quality) to attract customers. |
Order SKU Potency vs. Peer Group dial | Potency is how effective your SKUs are at generating order volume compared to your peers e.g. in this sample this retailer is 88% more potent for generating orders than their peers A higher SKU potency typically provides more orders. |
Orders by Month chart | Volume of orders received by calendar month |
GTV by Month chart | Amount of Gross Transaction Value generated by calendar month |
Top tips
Coming soon
Further help
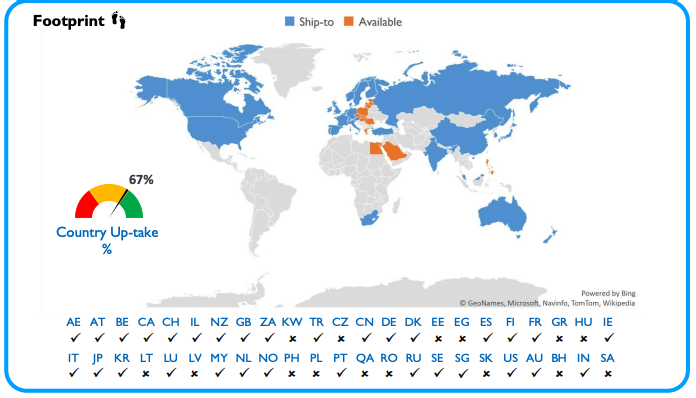
Section breakdown
Shows the countries in which you already sell (Ship to) against the countries which are available for you to sell to on the Fruugo platform (Available).
Element | Shows |
|---|---|
Map | Countries you currently Ship-to and countries which are additionally available to you to increase orders and GTV. |
Country Up-take % | The total percentage of available Fruugo countries to which you already sell. Aim is for this to be green to maximise your sales potential. |
Countries checklist | Ticks are where you currently sell Crosses are where you don’t sell, but could to grow sales - see top tips for more |
Top tips
Increase your sales footprint - additional countries represent a great opportunity to easily expand your global reach and sales, without any additional listing effort. You can switch on more sales countries easily and anytime by resubmitting your shipping template to us with the costs for the new countries included.
Country code | Country |
|---|---|
AE | United Arab Emirates |
AT | Austria |
BE | Belgium |
CA | Canada |
CH | Switzerland |
IL | Israel |
NZ | New Zealand |
GB | United Kingdom |
ZA | South Africa |
KW | Kuwait |
TR | Turkey |
CZ | Czechia |
CN | China |
DE | Germany |
DK | Denmark |
EE | Estonia |
EG | Egypt |
ES | Spain |
FI | Finland |
FR | France |
GR | Greece |
HU | Hungary |
IE | Ireland |
IT | Italy |
JP | Japan |
KR | South Korea |
LT | Lithuania |
LU | Luxembourg |
LV | Latvia |
MY | Malaysia |
NL | Netherlands |
NO | Norway |
PH | Philipines |
PL | Poland |
PT | Portugal |
QA | Qatar |
RO | Romania |
RU | Russia |
SE | Sweden |
SG | Singapore |
SK | Slovakia |
US | United States |
AU | Australia |
BH | Bahrain |
IN | India |
SA | Saudi Arabia |